In the 2020 apportionment, New York and Ohio each lost seats, while Montana gained a second seat and Rhode Island retained two seats. This result demonstrates a persistent small-state bias in the apportionment rounding process that dates back to the 1940 census.
The final apportionment changes from 2010 to 2020 are:
Texas: +2
Colorado, Florida, Montana, North Carolina, and Oregon: +1
California, Illinois, Michigan, New York, Ohio, Pennsylvania, and West Virginia: -1
Once the Census determines the country’s population, apportionment should be simple. Proportionality is the only constitutional requirement, aside from a guarantee of one representative for each state. The Institute for Social Research at the University of Michigan provides an easy-to-use apportionment calculator based on any population input.
Virtually all the controversy about apportionment involves the population count. But rounding also introduces additional problems, and rounding formulas can bias the result. This year, Montana and Rhode Island were beneficiaries of a quirk in the rounding process, while New York and Ohio were victimized.
The rounding formula for the US House, known as the Huntington-Hill Method, was enacted in 1941. This formula creates a small but consistent bias for less populous states.1
The Quota: the Starting Point for Reapportionment
Each state’s seat count is driven by its quota:
\[ Quota_{state} = \frac{\text{State Population}}{\text{US Population}} \times 435 \]
The quota uses a simple and intuitive computation. But it also includes a fractional remainder, and the apportionment scheme must somehow round the result to a whole number.
For 2020, New York’s seat quota is:
\[ \text{New York Quota} = \frac{20,215,751}{331,108,434} \times 435 \approx 26.56 \]
Montana’s quota is:
\[ \text{Montana Quota} = \frac{1,085,407}{331,108,434} \times 435 \approx 1.43 \] How does the apportionment process round these quotas into whole numbers? We presume that New York will round to either 26 or 27, and Montana rounds to 1 or 2. 2
In the ordinary sense of the word “round”, we draw a line at .5. Any value with a remainder above the lower integer is rounded up, and a remainder below .5 is rounded down. Using this definition, New York should round up from 26.56 to 27 and Montana rounds down from 1.43 to 1.
But under the current apportionment formula New York gets only 26 seats, while Montana would get 2. How is that possible?
Webster, Huntington-Hill, and the Method of Equal Proportions
The apportionment rounding problem is well documented, full of surprising wrinkles, and inherent in any proportional seat allocation method. Solutions for the rounding problem in the U.S. House date back to the 1790’s, and were associated with statesmen, including Hamilton, Jefferson, John Quincy Adams, and Daniel Webster.
In the decades before the 1940’s, Congress used a formula designed by Webster based on earlier work by Hamilton.3
The Webster formula uses the intuition that we should round up when the remainder is greater than .5, and round down if the remainder is less. But the formula must also determine how to guarantee the sum of the rounded allocations equals 435.4
The fractional remainders are unpredictable and rounding can throw off the sum. To demonstrate, suppose that the US is comprised of three states instead of 50 (and let’s say they are California, Oregon, and Washington). Using the Webster method and the December 2020 estimates, we see this result:
| State | Population | Pop Pct | Quota | Seats |
|---|---|---|---|---|
| California | 39,368,078 | 76.7 | 333.8 | 334 |
| Oregon | 4,241,507 | 8.3 | 36.0 | 36 |
| Washington | 7,693,612 | 15.0 | 65.2 | 65 |
| Total | 51,303,197 | 100.0 | 435.0 | 435 |
In this particular case, the rounded whole numbers add to 435, and we are finished.
But suppose we alter the population figures slightly. If the fractional remainders are distributed differently, the number of seats may add to a number greater or less than 435.
To solve this problem, we can alter the quota formula by increasing the US Population denominator. Some states will give up a seat while others are left alone.
\[ \text{Adjusted Quota}_{state} = \frac{\text{State Population}}{\text{US Population + Adjustment}} \times 435 \]
In the example below, the initial quotas generate a seat total of 436. By gradually increasing the denominator (adding to the total population), one state’s fractional remainder will eventually drop below .5.
When the denominator in the quota formula is increased by 26,780, California’s quota drops a hair below 334.5. Washington’s quota and Oregon’s quota drop too, but their fractional remainders don’t drop below the .5 threshold.
| State | Population | Pop Pct | Initial Quota | Initial Seats | Adjustment | Adjusted Quota | Adjusted Seats |
|---|---|---|---|---|---|---|---|
| California | 40,479,078 | 76.9 | 334.67 | 335 | 26,780 | 334.50 | 334 |
| Oregon | 4,441,507 | 8.4 | 36.72 | 37 | 26,780 | 36.70 | 37 |
| Washington | 7,693,612 | 14.6 | 63.61 | 64 | 26,780 | 63.58 | 64 |
| Total | 52,614,197 | 100.0 | 435.00 | 436 | 435 |
Simple enough, but the Webster method, and the Hamilton method that preceded it, produced some well known paradoxes and quirks that were more apparent when the number of seats routinely increased from census to census.
In 1880, we saw that Alabama would lose seats as a direct result of hypothetically increasing the total number of House seats, a result famously known as the Alabama Paradox. A related problem known as the Population Paradox was observed in 1902 when using the Hamilton formula (which is similar to the Webster formula), Virginia would have lost seats to Maine even though Virginia’s population increased by a greater percentage. 5
In order to prevent these scenarios, Congress replaced the Webster method in 1941 by a design by statistician Joseph Hill and adapted by Harvard mathematician Edward Huntington.
The Huntington-Hill formula ignores the .5 rounding threshold and instead uses the geometric mean of the two whole numbers closest to the state’s quota. The geometric mean of two consecutive integers is the square root of their product, and the rounding threshold ranges between .414 and .5.
If a state’s quota exceeds the geometric mean, we round up, and if not, we round down. But we can run into the same problem in the three state example: the sum might not add up to 435.
Small states have much smaller geometric means, compared to large states. Therefore we are more likely to round up small states than larger ones.
Example: A state with a quota of 3.48
We might think of the .5 threshold determined by the arithmetic mean between the two whole numbers surrounding a quota; if a state’s quota is 3.48, the two surrounding whole numbers are 3 and 4.
The arithmetic mean of 3 and 4 is 3.5. The geometric mean of 3 and 4 is approximately 3.46. Again, the Webster method uses the arithmetic mean and Huntington-Hill uses the geometric mean.6
For two consecutive whole numbers, the arithmetic mean of n and n+1 = \[ \frac{2n + 1}{2} \] The fractional remainder of the arithmetic mean is always .5.
Since the quota of 3.48 falls below 3.5, the Webster method would round down to 3 seats.
The geometric mean of two consecutive integers is the square root of their product, and the remainder ranges between .414 and .5.
For two consecutive whole numbers, the geometric mean of n and n+1 = \[ \sqrt{n\times(n+1)} \] The geometric mean of 3 and 4 is
\[ \sqrt{3\times4} = \sqrt{12} \approx 3.464 \]
Since the quota of 3.48 in the example is greater than 3.464, the Huntington-Hill method rounds up to 4 seats.
The Huntington-Hill method reduces the likelihood of the Alabama Paradox and the Population Paradox, even though the difference between the arithmetic vs. geometric means goes away as the number of seats increases and the geometric mean approaches \((n + .5)\) But the difference between arithmetic vs. geometric means for states with smaller numbers of seats can be significant. In the figure below, the shaded region represents the gap.
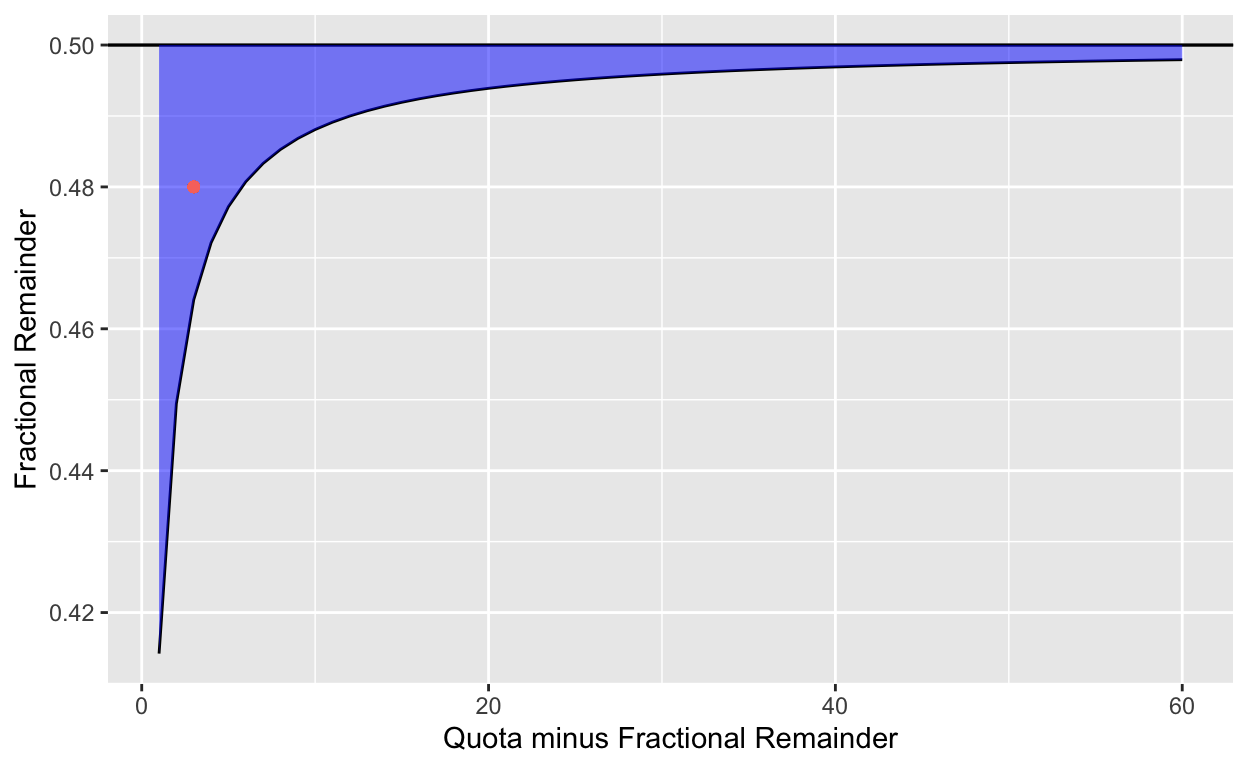
Figure 1: Rounding thresholds for Webster and Huntington-Hill methods. Quotas with fractional remainders in the shaded region are rounded down for Webster and up for Huntington-Hill, the method currently in use. The red dot places our example of a 3.48 quota. The shaded region on the left shows the small-state bias in Huntington-Hill.
The shaded area shows the region where a quota would produce different rounding results depending on the method chosen. Under today’s Huntington-Hill method, the threshold is the curved line. The likelihood of rounding up increases as the state’s relative population shrinks.
Neither the Webster nor the Huntington-Hill formula guarantees an allocation of 435 seats on the first pass. For 2020, the initial Huntington-Hill rounding produced a sum of 437 representatives before any adjustments.
To fix the problem, Huntington-Hill reduces the total seat count in the same way we saw in the three-state example: gradually increasing the US population denominator used to determine states’ quotas. Eventually, some states above the rounding threshold will drop below it. Thus, two states will lose a representative, which gets us to 435.
The two states that lost seats after this adjustment are Ohio and New York.
Increasing the US population denominator by 794,110 reduces the seat total from 437 to 435, and the quotas for Ohio and New York were close enough to their respective geometric means that they lost a seat they would have otherwise received from simple rounding.
Several smaller states had quotas with smaller fractional remainders than New York and Ohio, but their allocations based on simple rounding were unscathed. Montana won a second seat despite its small 1.43 quota, and Idaho nearly won a third seat even with a quota of 2.42. Rounding up is more likely for small states in a formula based on the geometric mean.
The Webster method gets 2020 right on the first try with a sum of 435. That method assigns Montana and Rhode Island only 1 seat each, while New York gets 26 and Ohio gets 16. Sometimes both of these formulas gets to 435 without any adjustment, and sometimes they don’t.
The version of the Huntington-Hill formula documented by the U.S. Census (and described at the Census press conference) adapts this logic in a clever way. That version, named the Method of Equal Proportions, generates a sequence that assigns seats by number after one seat is allocated to all 50 states, from 51 to 435. The result is identical to the rounding and adjusting process I described, and explained more completely in an addendum below.7
Since Huntington-Hill was adopted, how many states have been penalized as much as New York and Ohio in the 2020 apportionment?
Starting with 1940, nine censuses through 2020 have produced 446 individual state apportionments under Huntington-Hill. Only 17 of these 446 allocations rounded down a state’s apportionment with an initial quota fractional remainder greater of than .5.
As the table shows, the largest residual (i.e., the state losing a seat with the biggest rounding error) was California in the 1950 census, with an extremely large fractional remainder of .722.
This year, New York produced the sixth greatest difference between its quota and seats since 1940.
Notice that 13 of these 17 unlucky seat allocations had came from states with seat counts of 10 or more.
| State | Year | Seats | Quota | Quota_minus_seats |
|---|---|---|---|---|
| California | 1950 | 30 | 30.722 | 0.722 |
| California | 1980 | 45 | 45.584 | 0.584 |
| Pennsylvania | 1960 | 27 | 27.576 | 0.576 |
| Indiana | 1980 | 10 | 10.574 | 0.574 |
| Illinois | 1960 | 24 | 24.559 | 0.559 |
| New York | 2020 | 26 | 26.559 | 0.559 |
| Tennessee | 1950 | 9 | 9.553 | 0.553 |
| Kentucky | 1950 | 8 | 8.546 | 0.546 |
| Massachusetts | 1960 | 12 | 12.543 | 0.543 |
| New Jersey | 1990 | 13 | 13.536 | 0.536 |
| Massachusetts | 1990 | 10 | 10.532 | 0.532 |
| Missouri | 1960 | 10 | 10.524 | 0.524 |
| Georgia | 1980 | 10 | 10.524 | 0.524 |
| New York | 1990 | 31 | 31.521 | 0.521 |
| Ohio | 2020 | 15 | 15.514 | 0.514 |
| Connecticut | 1970 | 6 | 6.505 | 0.505 |
| Oregon | 1970 | 4 | 4.501 | 0.501 |
Compare this list with luckier states receiving an additional seat with a residual less than .5:8
| State | Year | Seats | Quota | seats_minus_quota |
|---|---|---|---|---|
| Nevada | 1940 | 1 | 0.366 | 0.634 |
| Montana | 2020 | 2 | 1.426 | 0.574 |
| South Dakota | 1970 | 2 | 1.436 | 0.564 |
| Rhode Island | 2020 | 2 | 1.443 | 0.557 |
| California | 2000 | 53 | 52.447 | 0.553 |
| Nevada | 1950 | 1 | 0.465 | 0.535 |
| North Carolina | 2000 | 13 | 12.470 | 0.530 |
| Arkansas | 1940 | 7 | 6.473 | 0.527 |
| Minnesota | 2010 | 8 | 7.478 | 0.522 |
| New Hampshire | 1960 | 2 | 1.479 | 0.521 |
| Rhode Island | 2010 | 2 | 1.485 | 0.515 |
| Montana | 1970 | 2 | 1.496 | 0.504 |
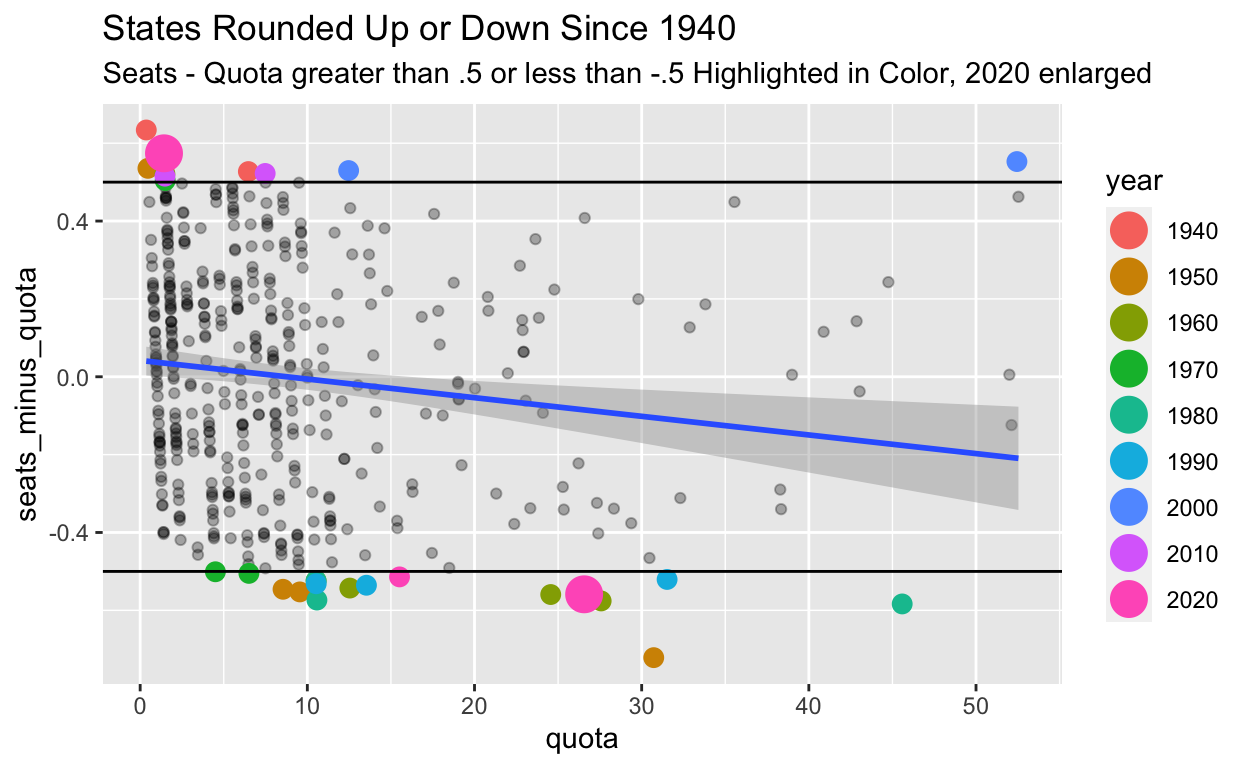
Figure 2: State quotas vs. fractional remainder of seat allocations. Positive seats-minus-quota means the formula rounded up, and negative seats-minus-quota means it rounded down. The beneficiaries of a significantly positive rounding are less populous states.
Notice that the constitutional guarantee of one seat has rarely assigned to seat to a state with a tiny quota.9
Montana set a record in 2020 with the most generous rounding boost since Huntington-Hill was adopted.
In every recent census, Montana lives on the bubble between one and two seats. But a quota below 1.5, such as Montana and Rhode Island in 2020, rarely produces two seats.
How many times has Huntington-Hill formula differed from the result generated by Webster?
Webster would have produced a different apportionment result 10 times since 1940. Usually, we see one instance per census, but in 2020 there were two. Montana and Rhode Island won seats that Webster would have given to New York and Ohio. In all 10 instances, a seat shifts from a bigger state to a much smaller one.
| State | Year | Quota | Actual | Webster |
|---|---|---|---|---|
| New York | 2020 | 26.56 | 26 | 27 |
| Ohio | 2020 | 15.51 | 15 | 16 |
| North Carolina | 2010 | 13.46 | 13 | 14 |
| Massachusetts | 1990 | 10.53 | 10 | 11 |
| Indiana | 1980 | 10.57 | 10 | 11 |
| Connecticut | 1970 | 6.51 | 6 | 7 |
| Oregon | 1970 | 4.50 | 4 | 5 |
| Massachusetts | 1960 | 12.54 | 12 | 13 |
| California | 1950 | 30.72 | 30 | 31 |
| Michigan | 1940 | 17.45 | 17 | 18 |
| State | Year | Quota | Actual | Webster |
|---|---|---|---|---|
| Montana | 2020 | 1.43 | 2 | 1 |
| Rhode Island | 2020 | 1.44 | 2 | 1 |
| Rhode Island | 2010 | 1.48 | 2 | 1 |
| Oklahoma | 1990 | 5.52 | 6 | 5 |
| New Mexico | 1980 | 2.50 | 3 | 2 |
| Montana | 1970 | 1.50 | 2 | 1 |
| South Dakota | 1970 | 1.44 | 2 | 1 |
| New Hampshire | 1960 | 1.48 | 2 | 1 |
| Kansas | 1950 | 5.53 | 6 | 5 |
| Arkansas | 1940 | 6.47 | 7 | 6 |
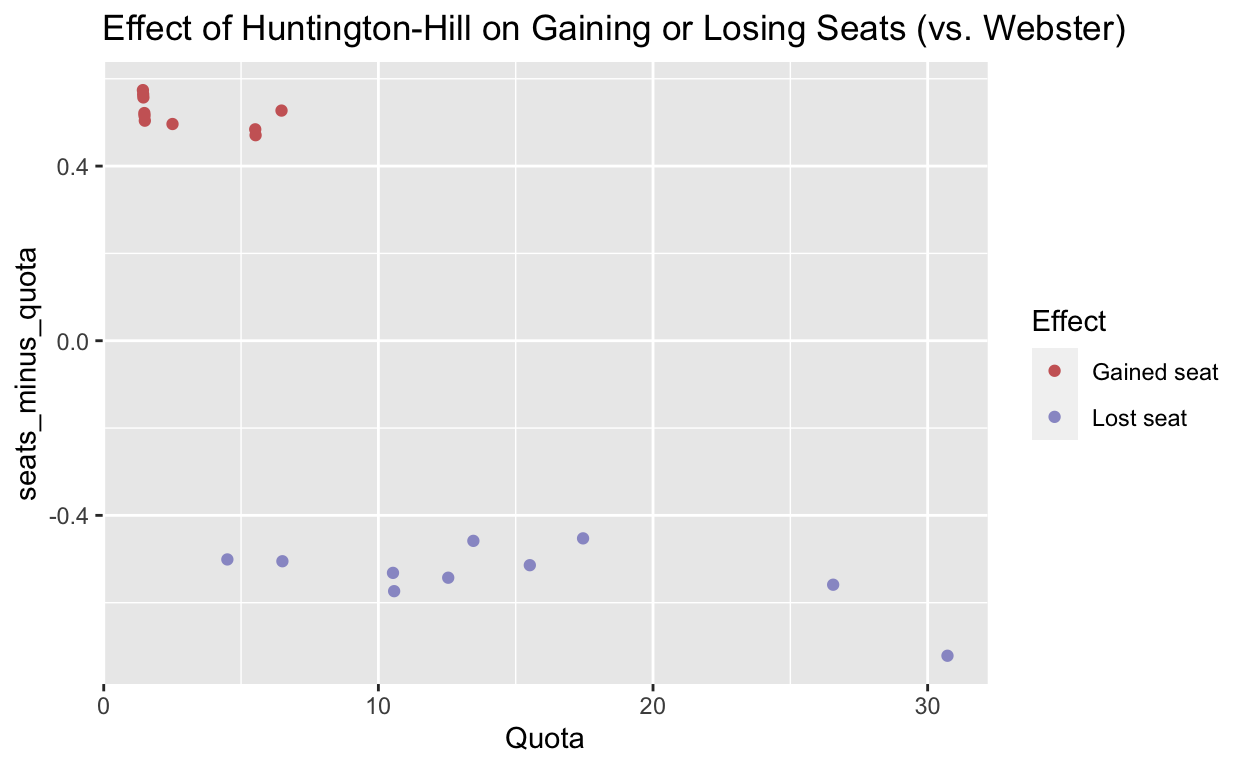
Figure 3: Instances since 1940 when Huntington-Hill and Webster assign different results by state and year
Ironically, Montana contested the 1990 apportionment in court, arguing that the Huntington-Hill method unfairly denied them a second seat in 1990. Montana claimed the process should be based instead on the never-used “Dean” method.10 The case Department of Commerce v. Montana went to the Supreme Court, which decided in favor of the Huntington-Hill allocation in the 1990 census.11
Despite this challenge, Montana became a significant beneficiary of Huntington-Hill in 2020, a development they did not forsee in the 1990’s.
Given the strange rounding process, it’s hard to argue that Montana deserves a second House seat, The Constitution created an entire chamber dedicating to protecting an unfair numerical advantage of small states. The Senate bias is bad, and House shouldn’t make matters worse.
Addendum: Why does the census website show that we assign individual seats in order from 51 to 435?
A clever way to regenerate the Huntington Hill method is described on the census, described as the method of equal proportions, and detailed here: https://www.census.gov/prod/cen2010/briefs/c2010br-08.pdf
The process works like this:
Assign one seat to every one of the states.
Assign the remaining 385 seats (i.e., seats numbered 51 through 435) as follows:
Compute an initial “priority score” for each state, taking its population divided by the geometric mean of 1 and 2.
Specifically, each state’s initial priority score is equal to its population divided by \(\sqrt{1\times 2}\), which equals its population divided by roughly 1.41.
Identify the state with the highest priority score and assign the 51st seat to that state. Because every denominator in the priority score calculation is the same at this point, the 51st seat goes to the state with the greatest population.
The 51st seats thus goes to California.
Reduce that state’s priority score by calculating its population divided by the geometric mean of 2 and 3. We adjust this way because 2 is the state’s new, larger number of seats.
Since California won the 51st seat and now has 2, divide its population by \(\sqrt{2\times 3}\) or \(\sqrt{6} = 2.449\). Its priority score goes down accordingly. This reduction is enough to drop California out of first place.
Reorder the priority scores. The 52nd seat goes to the state with the newly determined highest priority score. This year, the 52nd seat goes to Texas. Just like California before it, Texas’s priority score is recomputed to a lower value.
Repeat steps e and f until all 435 seats have been allocated. In each iteration, the priority score is recalculated and reduced, and the state awarded a given seats (probably) moves somewhere further back in the line.
Look at assignments if the continued past seat 435; we get New York at 436 and Ohio at 437. Earlier, we saw those were the two states that lost seats when we simply altered the US population denominator.
When we iterate like this, Minnesota wins of the 435th seat, while New York comes in 436th. The margin was historically close, and if Minnesota had 26 fewer residents it would have traded places with New York and lost its eighth seat.
So why is Montana (and not Minnesota) the relevant comparison in this critique? Because Montana, along with Rhode Island, gets an enomrous break in the adjustment from the Webster method to Huntington-Hill. Minnesota, with a quota of 7.501, winds up with 8 seats using either the Huntington-Hill or Webster method.12
| Seat Number | State | Total Seats | Population | Loss Drops a Seat | Pct to Drop Seat |
|---|---|---|---|---|---|
| 431 | Oregon | 6 | 4,241,500 | 62,408 | 1.471 |
| 432 | Colorado | 8 | 5,782,171 | 72,445 | 1.253 |
| 433 | California | 52 | 39,576,757 | 284,400 | 0.719 |
| 434 | Montana | 2 | 1,085,407 | 6,371 | 0.587 |
| 435 | Minnesota | 8 | 5,709,752 | 26 | 0.000 |
| Seat Number | State | Total Seats | Population | Gain to Add Seat | Pct to Add Seat |
|---|---|---|---|---|---|
| 436 | New York | 26 | 20,215,751 | 89 | 0.000 |
| 437 | Ohio | 15 | 11,808,848 | 11,462 | 0.097 |
| 438 | Texas | 38 | 29,183,290 | 189,644 | 0.650 |
| 439 | Florida | 28 | 21,570,527 | 171,561 | 0.795 |
| 440 | Arizona | 9 | 7,158,923 | 79,509 | 1.111 |
In a 2001 Brookings Institute report, economist H. Peyton Young writes, “Not only is it unnecessarily complex—involving square root formulas—it demonstrably favors small states at the expense of large states.” https://www.brookings.edu/research/dividing-the-house-why-congress-should-reinstate-an-old-reapportionment-formula/] See Also https://www.census.gov/programs-surveys/popest/data/tables.html]↩︎
This expectation has a name: the Quota Rule, and we can devise a system capable of violating it. See Young, H P , Balinski, M L (2010) Fair Representation: Meeting the Ideal of One Man, One Vote United States Brookings Institution Press↩︎
Among many excellent summaries of the history (Young 2001) a Supreme Court ruling in 1992 lays out the formula variations over time. The Court overturned a lower court ruling that reinstated a second Montana seat from the 1990 census and supported the Huntington Hill formula in use since 1941.↩︎
The fractional remainders of quotas should be uniformly distributed between zero and one. In practice, we can observe evaluate the distribution for uniformity using a chi-squared test.↩︎
Among the many explainers available, Vicki Powers published useful slide deck at http://www.mathcs.emory.edu/~vicki/talks/Apportionment_Sept2012.pdf. Also see Nurmi H. (1999) Paradoxes of Representation. In: Voting Paradoxes and How to Deal with Them. Springer, Berlin, Heidelberg. https://doi.org/10.1007/978-3-662-03782-9_9↩︎
If \(n\) = the lower of the two whole numbers surrounding the quota.↩︎
See the census brief that explains the apportion formula at https://www.census.gov/prod/cen2010/briefs/c2010br-08.pdf)↩︎
Nevada is the only state in recent history whose entire quota fell below 0.5 (in 1940 and 1950). The Huntington-Hill formula almost mathematically guarantees such states round up to one seat, and of course, the Constitution guarantees a seat.↩︎
The geometric mean of 0 and 1 equals 0, which means a state with a tiny population will still round up to one using Huntington-Hill. In any event, Nevada in 1940 and 1950 are the only cases since 1940 where the quota fell below 0.5↩︎
https://www.maa.org/press/periodicals/convergence/apportioning-representatives-in-the-united-states-congress-deans-method-of-apportionment↩︎
Minnesota’s quota in 2020 was 7.501, a hair greater than 7.5, and slightly increased from 2010. Its quota then was 7.478. It still managed to win an 8th seat in 2010.↩︎